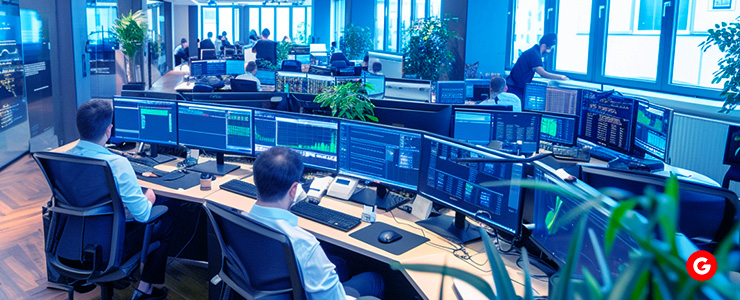
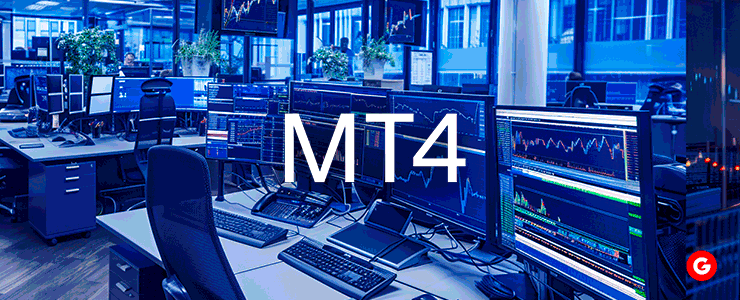
Identifying future trends is an important part of a trader’s job. Predicting possible price movements is generally done through a series of technical analyses. A specific advanced MT4 indicator can help you make these analyses more smoothly and accurately.
Generally, most of these technical analyses are made by looking into the previous data and comparing it with the current market situation. With indicators such as the Moving Average Convergence Divergence (MACD), Money Flow Index, On-Balance Volume, etc., your price action strategies are more convenient with a better market understanding.
These indicators help you make decisions and allow you to find the perfect points to enter or exit by looking into what the trend might be in the long run. There are a lot of indicators that you, as a trader, should be aware of before you start making purchases or selling in the market.
Moving Average Convergence Divergence
This is one of the most popular advanced MT4 indicators, and it is very helpful to long-term traders. This indicator is a trend-follower, which means it expresses the relationship between two moving averages.
This indicator can be interpreted in three basic ways:
- Crossovers: When it is recommended that you sell, your MACD will drop below a single line. This is a bearish signal. But if the line goes above the single line, that means it might be a good time to buy. Generally, an FX owner looks for a confirmation on a crossover before they enter a position.
- Divergence: As the name suggests, this is when the asset’s price diverges from MACD. It means that the current trend has ended.
- Dramatic Rise: This happens when the price rises much more than expected. This is an extreme case. It occurs when the shorter moving average moves away from the long-term MA. So, here, the security is generally bought in access, and then, over time, it moves back to its normal value.

Advances Trendlines Indicator
This is an advanced MT4 indicator that works with extreme accuracy.
The ATS in MT4 finds all the market trends and places them in precise places in an automatically generated chart. Two or more highs and lows are connected to showcase the trend.
These trendlines are best for amateur traders to use because they make it easier for them to place trendlines.
This is also helpful for advanced and professional traders as this validates their analysis.
Money Flow Index (MFI)
MFI in MT4 makes use of the instrument’s price and volume. This is done to forecast the reliability of the present trends. MFI is also called volume-weighted RSI (Relative Strength Index).
Arriving at these figures requires a lot of steps. You have to start by defining the typical price and calculating the RMF. Once you determine this, you are required to follow a sum:
14-period positive money flow/14-period negative money flow
Positive values will be created if the typical price> the previous value. It would be the other way if there is a negative money flow.
End this by using:
100- [100 / (1 + Money Flow Ratio)].
Any divergence that happens might lead to changes in the current trends.
Bollinger Bands
The Bollinger bands indicator measures market volatility and defines high and low prices. Traders generally use this indicator to confirm their entry and exit signals.
This indicator has three main elements:
- Moving Average
- Upper Band: It represents the sum of moving averages and the standard deviation of the price
- Lower Band: this is where the values of the moving average are subtracted by the standard deviation of the price
Accumulation or Distribution Line
One of the most common indicators in MT4 is Accumulation/Distribution. It considers the closing prices of a given security over a period of time and the trading range for the same period.
Hence, because of its wider capabilities, it can give a very accurate illustration of the money flow in the market.
An upper trend line indicates an upward trend in buying. On the other hand, a downward line means increasing pressure to sell a particular security.
Market Facilitation Index
MFI is an MT4 indicator that helps change the prices of specific ticks. The values you get from MFI are a sign of value changes.
As the BW FMI increases, the volume of the indicator increases. This means traders are opening more positions. So, this is a sign that the market is picking up pace, and hence, you should plan your next move.
It also gives very precise information on the number of players entering and exiting a particular market, expressed in terms of the number of people. This will help you understand the competition in the market.
For a better and safer experience using any of the above indicators, make sure to start by using FXGiants for easy trades.
FAQs
What is the most powerful MT4 indicator?
One of the most powerful MT4 indicators is the Moving Average Convergence Divergence (MACD). This very accurate indicator helps you make crucial trading decisions.
What is the best volatility indicator on MT4?
The Kelter channel is a prevalent indicator of volatility in the trade market. It is highly automated when it comes to giving out charts.
Which is the fastest leading indicator?
One of the fastest-moving indicators has to be the Relative Strength Index. As a leading indicator, it only tells about accelerations in price movement.
Conclusion
Indicators on MT4 can greatly help both amateurs and industry experts. They collect data and present it to you in a visual form, which aids you in making better decisions while buying and selling. If you pick any advanced MT4 indicator, it will provide valuable data and save you a lot of time that might have gone into the research for your trade.
DISCLAIMER: This information is not considered investment advice or an investment recommendation, but is instead a marketing communication

